05 - Extract and Save Basic Panicle Features
Otho Mantegazza
2019-03-04
Source:vignettes/05-extract-features.Rmd
05-extract-features.RmdExtract features
You can easily extract features from a panicle object, such as number of branches and spikelets. Any panicle object is build upon an igraph object, so you can use functions from igraph to extract features from panicles. Or learn a few tricks below.
We can start from the object good_panicle.
good_panicle %>% plot_panicle()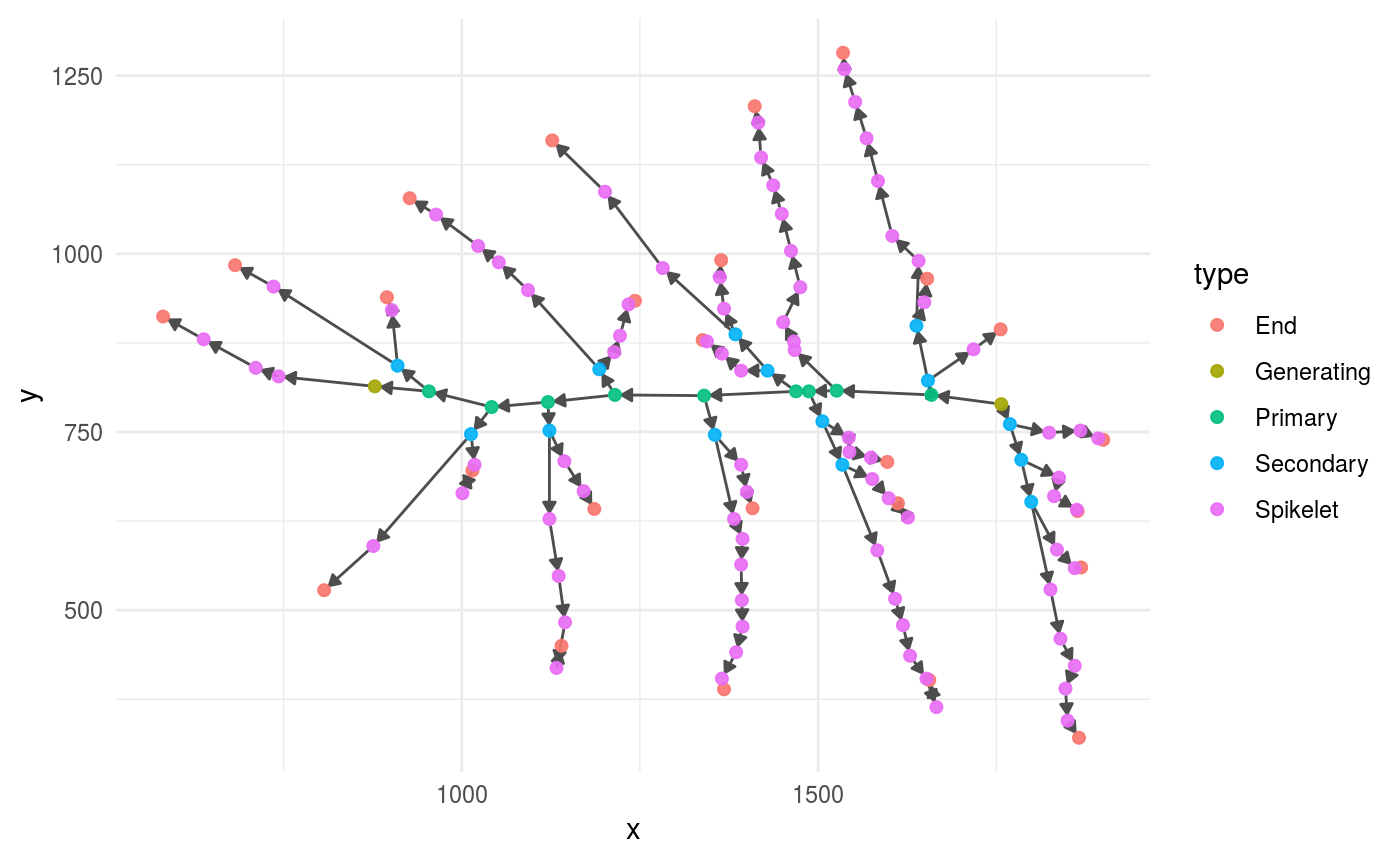
Features from one panicle with vertex_attr()
The function vertex_attr() from igraph extracts the attributes from all the nodes (vertexes) of a panicle.
nodes_df <-
  good_panicle %>%
  vertex_attr() %>%
  # The output of vertex_attr() is a list,
  # but  we can manipulate it more easily
  # if we turn it into a data frame
  as_tibble()
This is the output of vertex_attr(), the column type stores the type of each node (primary, secondary, etc.):
| x | y | type | id | rank |
|---|---|---|---|---|
| 1384 | 887 | Secondary | java.awt.Point[x=1384,y=887] | 1 |
| 1487 | 807 | Primary | java.awt.Point[x=1487,y=807] | 2 |
| 1757 | 789 | Generating | java.awt.Point[x=1757,y=789] | 3 |
| 1121 | 792 | Primary | java.awt.Point[x=1121,y=792] | 4 |
| 1638 | 899 | Secondary | java.awt.Point[x=1638,y=899] | 5 |
| 1866 | 321 | End | java.awt.Point[x=1866,y=321] | 6 |
loop over many panicles with map() and reduce()
load many panicles
As in the previous vignette “Visualize Many Panicles at Once with a Loop”, you can parse many panicles and put them in a list. Check that vignette for a thorough explanation of these step:
path_to_folder <- system.file(package = "ptrapr") %>%
  paste0("/extdata")


# First record the names of the files
# substitute path_to_folder with the path to your folder
panicle_paths <-
  list.files(path_to_folder) %>%
  # remove the extension (variable part)
  # each panicle has two files with different extension
  str_remove(".ricegr|.ricepr") %>%
  # store the name of the files without the extension
  unique()

# Store file names in named object, to use them later
panicle_paths <-
  panicle_paths %>%
  {set_names(x = paste(path_to_folder, ., sep = "/"), nm = .)}

# Parse them in a list, using file name as list names
panicle_list <-
  panicle_paths %>%
  map(~read_full_panicle(.))


# Then correct the edges on the main axis with invert_edges()
panicle_list <-
  panicle_list %>%
  map(~invert_edges(., check_before = TRUE))


names(panicle_list)
## [1] "1_1_6307" "1_2_6308" "1_3_6309" "2_1_6310" "2_2_6311" "2_3_6312"
## [7] "3_1_6313" "3_2_6314" "3_3_6315"Now all the panicles are collected in a named list,
Store features from many panicles in a dataset
you can use map(), bind_rows() and spread() to collect all the features in a database.
panicles_feature <-
  panicle_list %>%
  # This is the core of the loop in which
  # we apply the steps to extract panicle features
  # on all the panicles
  map(~vertex_attr(.) %>%
        as_tibble() %>%
        group_by(type) %>%
        count()) %>%
  # The next steps transform the list of panicle features
  # into a tidy dataset
  bind_rows(.id = "id") %>%
spread(key = "type", value = "n")| id | End | Generating | Primary | Secondary | Spikelet |
|---|---|---|---|---|---|
| 1_1_6307 | 25 | 2 | 10 | 12 | 85 |
| 1_2_6308 | 16 | 2 | 9 | 5 | 69 |
| 1_3_6309 | 20 | 2 | 9 | 9 | 71 |
| 2_1_6310 | 27 | 2 | 10 | 14 | 96 |
| 2_2_6311 | 24 | 2 | 9 | 12 | 86 |
| 2_3_6312 | 24 | 2 | 10 | 12 | 74 |
| 3_1_6313 | 23 | 2 | 10 | 11 | 103 |
| 3_2_6314 | 19 | 2 | 6 | 10 | 76 |
| 3_3_6315 | 25 | 2 | 9 | 14 | 79 |
The last step, spread(), is not necessary, but it is suggested to tidy your dataset. Since, according to the tidy data concept, each observation must have its own row. Here we use spread() to collect all observations about one single panicle that are scattered across multiple rows, and to put them in one single row.
Let me know if you want me to code these steps in a function.
More about igraph and tidygraph
Check the igraph website for a details about it, also tidygraph can be useful.