class: center, middle, inverse, title-slide # The Tidyverse, Part 4 ## “Science is what we understand well enough to explain to a computer; R is everything else.” ### Otho Mantegazza<br>2019-11-20 --- class: blueblue, middle .big[More of the same...] --- # Milano Open Data .pull-left[ .middle[ The city of Milan releases carefully curated and well organized open data. Check the website: https://dati.comune.milano.it/ Also Regione Lombardia has a great open data portal: https://www.dati.lombardia.it/ Did you know that, in **Europe**, you can ask for **Open Data** to the of public administration? ] ] .pull-right[ .middle[ </p> <a href="https://dati.comune.milano.it/" class="imagelink"> <img src="img/milano.svg" alt="stemma-milano" height="500" width="400"></a> <p> ] ] --- # Let's download some... Air pollution in Milan: https://dati.comune.milano.it/dataset/ds417-rilevazione-qualita-aria-2019 ```r mil_url <- paste0("http://dati.comune.milano.it/dataset/", "3e752fec-06fd-421b-ae9b-4d5d7a177640/", "resource/698a58e6-f276-44e1-92b1-3d2b81a4ad47/download/", "qaria_datoariagiornostazione_2019-11-12.csv") mil_path <- here::here("data/qaria_datoariagiornostazione_2019-11-12.csv") ``` ```r download.file(url = mil_url, destfile = mil_path) ``` --- # Let's read the data... ```r dat_mil <- read_csv(mil_path) ``` ``` ## Parsed with column specification: ## cols( ## stazione_id = col_double(), ## data = col_date(format = ""), ## inquinante = col_character(), ## valore = col_double() ## ) ``` ```r dat_mil %>% print(n = 6) ``` ``` ## # A tibble: 4,992 x 4 ## stazione_id data inquinante valore ## <dbl> <date> <chr> <dbl> ## 1 1 2019-01-03 NO2 NA ## 2 3 2019-01-03 NO2 51 ## 3 3 2019-01-03 CO_8h 1.2 ## 4 4 2019-01-03 PM10 29 ## 5 4 2019-01-03 NO2 139 ## 6 4 2019-01-03 CO_8h 1.3 ## # … with 4,986 more rows ``` --- class: exercise, middle .exercise-title[Exercise:] .exercise-body[ Describe the data: - How are they structured? - What's stored in the columns? What's their type? - Are there any NA? ] --- # Six Pollutants over Eight Stations .pull-left[ ```r dat_mil %>% count(stazione_id) ``` ``` ## # A tibble: 8 x 2 ## stazione_id n ## <dbl> <int> ## 1 1 192 ## 2 2 1152 ## 3 3 384 ## 4 4 768 ## 5 5 384 ## 6 6 960 ## 7 7 576 ## 8 8 576 ``` ] .pull-right[ ```r dat_mil %>% count(inquinante) ``` ``` ## # A tibble: 7 x 2 ## inquinante n ## <chr> <int> ## 1 C6H6 768 ## 2 CO_8h 768 ## 3 NO2 1536 ## 4 O3 576 ## 5 PM10 768 ## 6 PM25 384 ## 7 SO2 192 ``` ] --- class: exercise, middle .exercise-title[Exercise:] .exercise-body[ Use a visualization to learn when were the records taken? ] --- ```r dat_mil %>% group_by(stazione_id, inquinante) %>% count() ``` ``` ## # A tibble: 26 x 3 ## # Groups: stazione_id, inquinante [26] ## stazione_id inquinante n ## <dbl> <chr> <int> ## 1 1 NO2 192 ## 2 2 C6H6 192 ## 3 2 NO2 192 ## 4 2 O3 192 ## 5 2 PM10 192 ## 6 2 PM25 192 ## 7 2 SO2 192 ## 8 3 CO_8h 192 ## 9 3 NO2 192 ## 10 4 C6H6 192 ## # … with 16 more rows ``` --- class: exercise, middle .exercise-title[Exercise:] .exercise-body[ Count the NAs per column of the dataset. ] --- count: false .pull-left-reveal[ ```r *dat_mil ``` ] .pull-right-reveal[ ``` ## # A tibble: 4,992 x 4 ## stazione_id data inquinante valore ## <dbl> <date> <chr> <dbl> ## 1 1 2019-01-03 NO2 NA ## 2 3 2019-01-03 NO2 51 ## 3 3 2019-01-03 CO_8h 1.2 ## 4 4 2019-01-03 PM10 29 ## 5 4 2019-01-03 NO2 139 ## 6 4 2019-01-03 CO_8h 1.3 ## 7 4 2019-01-03 C6H6 1.5 ## 8 5 2019-01-03 NO2 NA ## 9 5 2019-01-03 O3 NA ## 10 2 2019-01-03 SO2 2.5 ## # … with 4,982 more rows ``` ] --- count: false .pull-left-reveal[ ```r dat_mil %>% * ggplot(aes(x = stazione_id, * y = inquinante, * colour = is.na(valore))) ``` ] .pull-right-reveal[ <!-- --> ] --- count: false .pull-left-reveal[ ```r dat_mil %>% ggplot(aes(x = stazione_id, y = inquinante, colour = is.na(valore))) + * geom_count(alpha = .8) ``` ] .pull-right-reveal[ <!-- --> ] --- count: false .pull-left-reveal[ ```r dat_mil %>% ggplot(aes(x = stazione_id, y = inquinante, colour = is.na(valore))) + geom_count(alpha = .8) + * theme_bw() ``` ] .pull-right-reveal[ <!-- --> ] --- count: false .pull-left-reveal[ ```r dat_mil %>% ggplot(aes(x = stazione_id, y = inquinante, colour = is.na(valore))) + geom_count(alpha = .8) + theme_bw() + * scale_size_continuous( * limits = c(0, NA) * ) ``` ] .pull-right-reveal[ <!-- --> ] --- # Some missing data are implicit https://tidyr.tidyverse.org/reference/complete.html ```r # complete dat_mil_all <- dat_mil %>% complete(stazione_id, nesting(data, inquinante)) ``` ```r dat_mil_all %>% print(n = 6) ``` ``` ## # A tibble: 10,602 x 4 ## stazione_id data inquinante valore ## <dbl> <date> <chr> <dbl> ## 1 1 2019-01-03 C6H6 NA ## 2 1 2019-01-03 CO_8h NA ## 3 1 2019-01-03 NO2 NA ## 4 1 2019-01-03 O3 NA ## 5 1 2019-01-03 PM10 NA ## 6 1 2019-01-03 PM25 NA ## # … with 1.06e+04 more rows ``` --- count: false .pull-left-reveal[ ```r *dat_mil_all ``` ] .pull-right-reveal[ ``` ## # A tibble: 10,602 x 4 ## stazione_id data inquinante valore ## <dbl> <date> <chr> <dbl> ## 1 1 2019-01-03 C6H6 NA ## 2 1 2019-01-03 CO_8h NA ## 3 1 2019-01-03 NO2 NA ## 4 1 2019-01-03 O3 NA ## 5 1 2019-01-03 PM10 NA ## 6 1 2019-01-03 PM25 NA ## 7 1 2019-01-03 SO2 NA ## 8 1 2019-01-04 C6H6 NA ## 9 1 2019-01-04 CO_8h NA ## 10 1 2019-01-04 NO2 NA ## # … with 10,592 more rows ``` ] --- count: false .pull-left-reveal[ ```r dat_mil_all %>% * ggplot(aes(x = stazione_id, * y = inquinante)) ``` ] .pull-right-reveal[ <!-- --> ] --- count: false .pull-left-reveal[ ```r dat_mil_all %>% ggplot(aes(x = stazione_id, y = inquinante)) + * geom_count() ``` ] .pull-right-reveal[ <!-- --> ] --- count: false .pull-left-reveal[ ```r dat_mil_all %>% ggplot(aes(x = stazione_id, y = inquinante)) + geom_count() + * theme_bw() ``` ] .pull-right-reveal[ <!-- --> ] --- count: false .pull-left-reveal[ ```r dat_mil_all %>% ggplot(aes(x = stazione_id, y = inquinante)) + geom_count() + theme_bw() + * scale_size_continuous( * limits = c(0, NA) * ) ``` ] .pull-right-reveal[ <!-- --> ] --- class: exercise, middle .exercise-title[Exercise:] .exercise-body[ Some rows might be duplicated. How would you remove them? ] --- class: exercise, middle .exercise-title[Exercise:] .exercise-body[ How would you visualize the amount of pollutants in the air by month? Draw some sketches by hand. What value would you map to what object of your sketch? ] --- ```r dat_mil_all %>% mutate(month = month(data, label = T)) %>% ggplot(aes(x = month, y = valore)) + geom_boxplot() + aes(fill = inquinante) ``` <!-- --> --- ```r dat_mil_all %>% ggplot(aes(x = data, y = valore)) + geom_point(alpha = .2) + aes(colour = inquinante) + geom_smooth() ``` 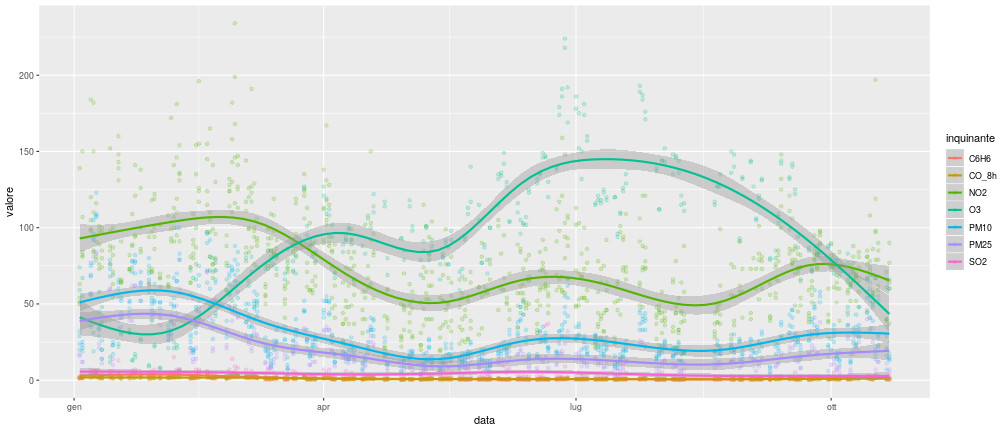<!-- --> --- # Pivot Pivoting: https://tidyr.tidyverse.org/articles/pivot.html 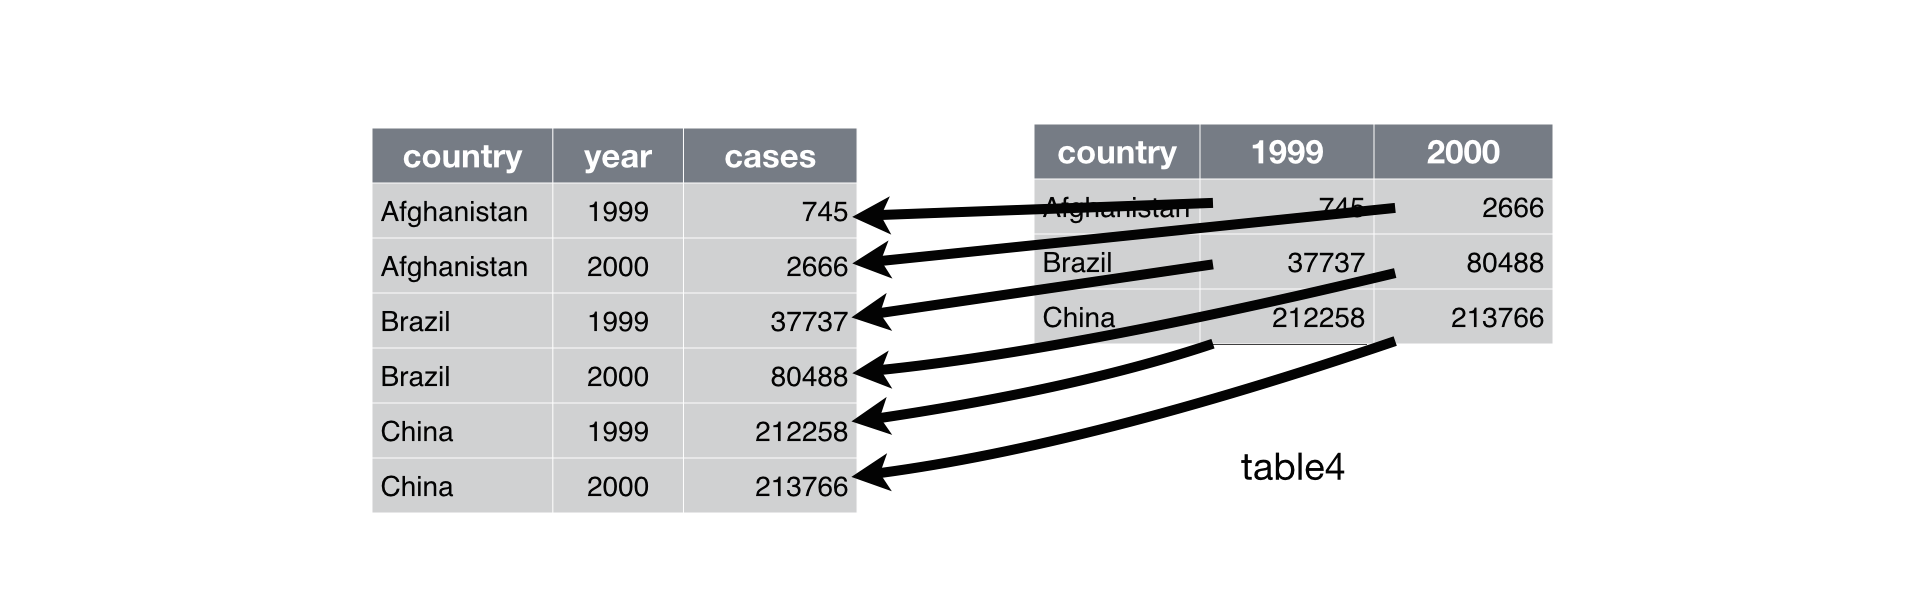 Image Credits: https://r4ds.had.co.nz/tidy-data.html --- count: false .pull-left-reveal[ ```r *dat_mil_all ``` ] .pull-right-reveal[ ``` ## # A tibble: 10,472 x 4 ## stazione_id data inquinante valore ## <dbl> <date> <chr> <dbl> ## 1 1 2019-01-03 C6H6 NA ## 2 1 2019-01-03 CO_8h NA ## 3 1 2019-01-03 NO2 NA ## 4 1 2019-01-03 O3 NA ## 5 1 2019-01-03 PM10 NA ## 6 1 2019-01-03 PM25 NA ## 7 1 2019-01-03 SO2 NA ## 8 1 2019-01-04 C6H6 NA ## 9 1 2019-01-04 CO_8h NA ## 10 1 2019-01-04 NO2 NA ## 11 1 2019-01-04 O3 NA ## 12 1 2019-01-04 PM10 NA ## 13 1 2019-01-04 PM25 NA ## 14 1 2019-01-04 SO2 NA ## 15 1 2019-01-07 C6H6 NA ## 16 1 2019-01-07 CO_8h NA ## 17 1 2019-01-07 NO2 NA ## 18 1 2019-01-07 O3 NA ## 19 1 2019-01-07 PM10 NA ## 20 1 2019-01-07 PM25 NA ## # … with 1.045e+04 more rows ``` ] --- count: false .pull-left-reveal[ ```r dat_mil_all %>% * pivot_wider( * names_from = inquinante, * values_from = valore * ) ``` ] .pull-right-reveal[ ``` ## # A tibble: 1,496 x 9 ## stazione_id data C6H6 CO_8h NO2 O3 PM10 ## <dbl> <date> <dbl> <dbl> <dbl> <dbl> <dbl> ## 1 1 2019-01-03 NA NA NA NA NA ## 2 1 2019-01-04 NA NA NA NA NA ## 3 1 2019-01-07 NA NA NA NA NA ## 4 1 2019-01-08 NA NA NA NA NA ## 5 1 2019-01-09 NA NA NA NA NA ## 6 1 2019-01-10 NA NA NA NA NA ## 7 1 2019-01-11 NA NA NA NA NA ## 8 1 2019-01-14 NA NA NA NA NA ## 9 1 2019-01-15 NA NA NA NA NA ## 10 1 2019-01-17 NA NA NA NA NA ## 11 1 2019-01-18 NA NA NA NA NA ## 12 1 2019-01-21 NA NA NA NA NA ## 13 1 2019-01-22 NA NA NA NA NA ## 14 1 2019-01-23 NA NA NA NA NA ## 15 1 2019-01-25 NA NA NA NA NA ## 16 1 2019-01-28 NA NA NA NA NA ## 17 1 2019-01-29 NA NA NA NA NA ## 18 1 2019-01-30 NA NA NA NA NA ## 19 1 2019-02-01 NA NA NA NA NA ## 20 1 2019-02-04 NA NA NA NA NA ## # … with 1,476 more rows, and 2 more variables: ## # PM25 <dbl>, SO2 <dbl> ``` ] --- count: false .pull-left-reveal[ ```r * # Pivot back *dat_mil_wide ``` ] .pull-right-reveal[ ``` ## # A tibble: 1,496 x 9 ## stazione_id data C6H6 CO_8h NO2 O3 PM10 ## <dbl> <date> <dbl> <dbl> <dbl> <dbl> <dbl> ## 1 1 2019-01-03 NA NA NA NA NA ## 2 1 2019-01-04 NA NA NA NA NA ## 3 1 2019-01-07 NA NA NA NA NA ## 4 1 2019-01-08 NA NA NA NA NA ## 5 1 2019-01-09 NA NA NA NA NA ## 6 1 2019-01-10 NA NA NA NA NA ## 7 1 2019-01-11 NA NA NA NA NA ## 8 1 2019-01-14 NA NA NA NA NA ## 9 1 2019-01-15 NA NA NA NA NA ## 10 1 2019-01-17 NA NA NA NA NA ## 11 1 2019-01-18 NA NA NA NA NA ## 12 1 2019-01-21 NA NA NA NA NA ## 13 1 2019-01-22 NA NA NA NA NA ## 14 1 2019-01-23 NA NA NA NA NA ## 15 1 2019-01-25 NA NA NA NA NA ## 16 1 2019-01-28 NA NA NA NA NA ## 17 1 2019-01-29 NA NA NA NA NA ## 18 1 2019-01-30 NA NA NA NA NA ## 19 1 2019-02-01 NA NA NA NA NA ## 20 1 2019-02-04 NA NA NA NA NA ## # … with 1,476 more rows, and 2 more variables: ## # PM25 <dbl>, SO2 <dbl> ``` ] --- count: false .pull-left-reveal[ ```r # Pivot back dat_mil_wide %>% * pivot_longer( * cols = C6H6:SO2, * names_to = "inquinante", * values_to = "valore" * ) ``` ] .pull-right-reveal[ ``` ## # A tibble: 10,472 x 4 ## stazione_id data inquinante valore ## <dbl> <date> <chr> <dbl> ## 1 1 2019-01-03 C6H6 NA ## 2 1 2019-01-03 CO_8h NA ## 3 1 2019-01-03 NO2 NA ## 4 1 2019-01-03 O3 NA ## 5 1 2019-01-03 PM10 NA ## 6 1 2019-01-03 PM25 NA ## 7 1 2019-01-03 SO2 NA ## 8 1 2019-01-04 C6H6 NA ## 9 1 2019-01-04 CO_8h NA ## 10 1 2019-01-04 NO2 NA ## 11 1 2019-01-04 O3 NA ## 12 1 2019-01-04 PM10 NA ## 13 1 2019-01-04 PM25 NA ## 14 1 2019-01-04 SO2 NA ## 15 1 2019-01-07 C6H6 NA ## 16 1 2019-01-07 CO_8h NA ## 17 1 2019-01-07 NO2 NA ## 18 1 2019-01-07 O3 NA ## 19 1 2019-01-07 PM10 NA ## 20 1 2019-01-07 PM25 NA ## # … with 1.045e+04 more rows ``` ] --- # Extend GGPLOT2 https://www.ggplot2-exts.org/gallery/ ```r # install.packages("GGally") library(GGally) ggpairs(dat_mil_wide) ``` --- .center[ 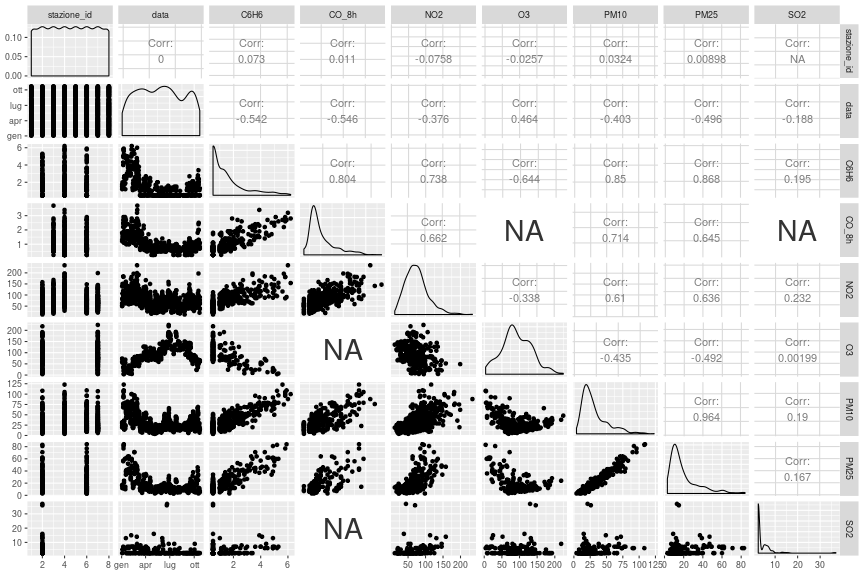<!-- --> ]